
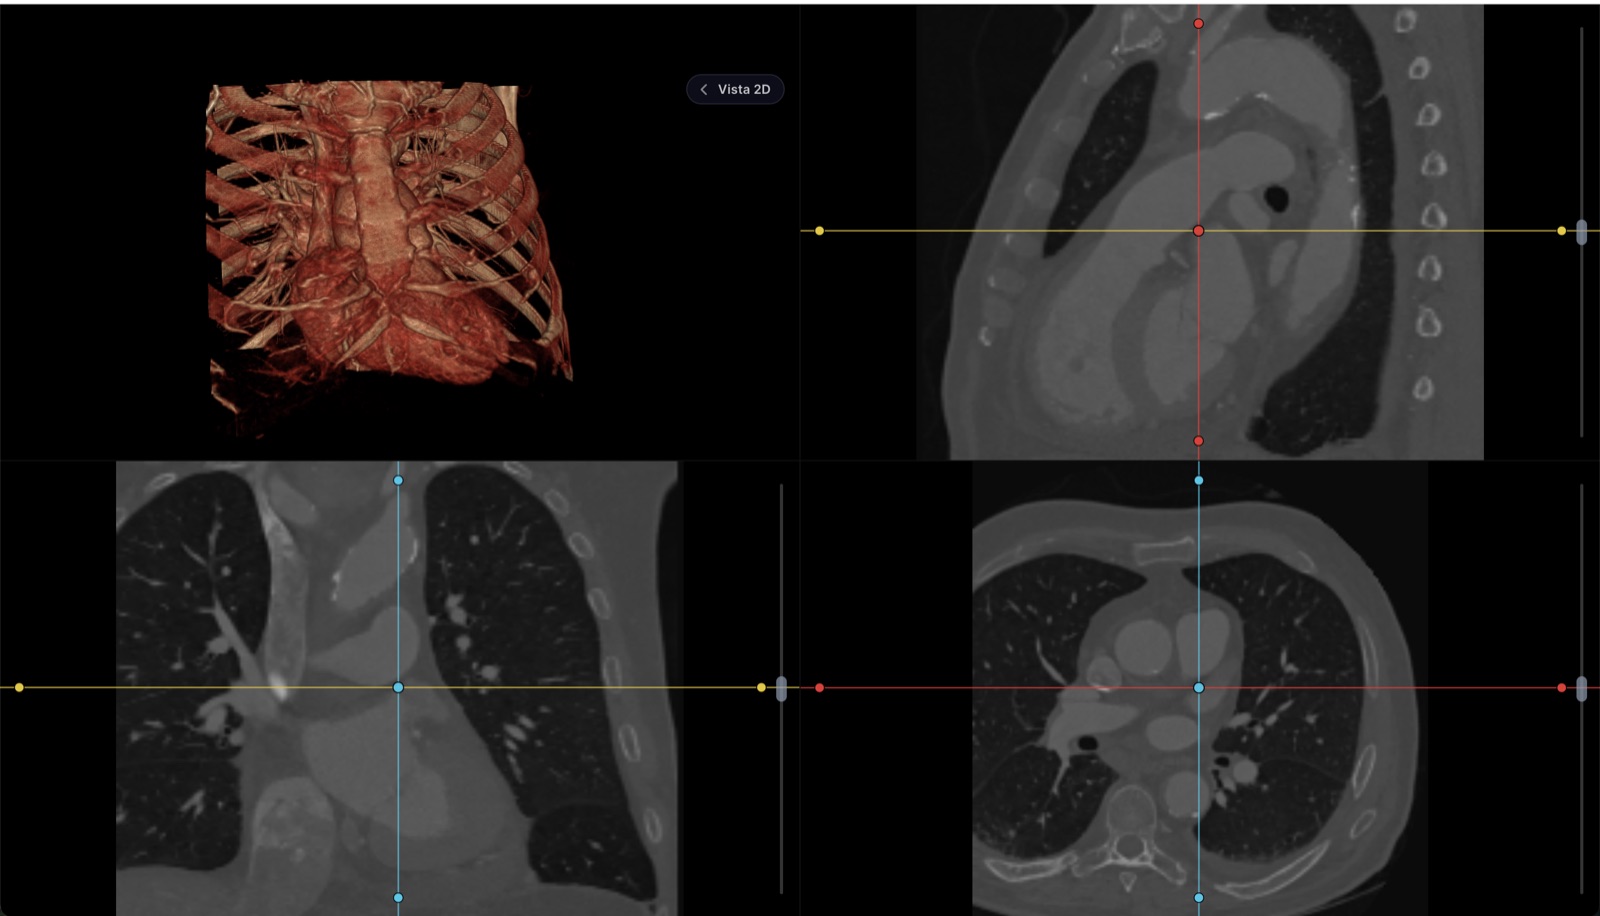
To view it, your study is not uploaded anywhere
The file is read and drawn inside your browser. It doesn't travel to our servers. Neither do your measurements or your report: they live in this tab's memory and vanish when you close it, so they leave no trace even on a shared computer. The only thing that leaves is what you choose to send: if you request the link for your doctor, the study is encrypted on this very device before upload, the key travels inside the link and never reaches us, and the file is deleted when it expires. We do keep a tally of the visit itself — how many files you opened, how much they weighed, how long it took to render and whether anything failed — so we know the viewer is doing its job; never the file names, never anything inside them.
Not for primary diagnostic reading
A formal diagnosis is issued on radiology-calibrated monitors. This tool is for reviewing, measuring, comparing and walking your patient through the study — not a replacement for the reading station.
Free, no account
View any DICOM or NIfTI series, or the PDF that comes on the CD
Window and level, zoom, cine and series comparison
Measurements in real millimeters, angles and annotations
Multiplanar reconstruction (MPR) and 3D view
Write the report and export or print it
Download your own files as a zip
Needs an account
Save the study to a patient's record
File the signed report next to the visit note
Keep measurements and key images across sessions
Receive studies straight from your machines via worklist
Share the study with the patient without burning a CD
Quick answer
How to view your MRI online, step by step
Copy the study off the CD or USB drive
Copy the complete folder to your computer — all of it, not just one subfolder. An MRI is split into many series, and the subfolder you skip is often the exact sequence your doctor mentioned. Files named IM000001 with no extension are normal: they are DICOM without the .dcm suffix.
Open everything in the viewer above
Click “Open my MRI” and select all the files, or drag the whole folder onto the dotted area. On a desktop there is an “Open a folder” button that takes the study in one go; on iPhone and iPad the folder picker doesn’t exist, so select the files in bulk or use the .zip from the imaging center.
Let the viewer sort the sequences
The files on the disc arrive in no anatomical order. The viewer groups them into series, orders every stack by real slice position, and lists the sequences so you can jump between them. All of this happens in your browser — nothing is uploaded.
Pick a series and scroll it
Start with the sequence your report talks about — T2 and FLAIR are the usual protagonists — and move through the slices with the wheel, the arrows or cine. Adjust brightness and contrast by dragging until the tissue separates.
Compare, measure, reconstruct
Put two series side by side — T1 next to T2, or pre- and post-contrast — and scroll to the same level. Trace lengths and angles in real millimeters. When a series has evenly spaced slices, multiplanar reconstruction lets you re-cut it in the other planes.
Save what you produced
The tab’s memory is the only place any of this exists. Export or print anything you want to keep before closing.
T1, T2, FLAIR: why your MRI comes in sequences
An MRI is not one scan — it is several acquisitions of the same anatomy, each tuned to make a different property of tissue visible. Radiologists call them sequences, and your CD keeps each one as a separate series. Reading an MRI is largely the act of comparing them: what is bright here and dark there tells you what kind of tissue — or problem — you are looking at.
| Sequence | What appears bright | What it is typically for |
|---|---|---|
| T1-weighted | Fat; fluid appears dark | Anatomy in fine detail |
| T2-weighted | Fluid and edema | Inflammation, swelling, many lesions |
| FLAIR | Lesions, with free fluid suppressed | Findings near fluid-filled spaces |
| Diffusion (DWI) | Tissue with restricted diffusion | Early stroke assessment, some lesions |
| T1 with contrast | Tissue that takes up gadolinium | Characterizing a finding after injection |
None of this replaces the radiologist’s report — the table is a reading companion, not a diagnostic key. Its practical use is humbler: when the report says a finding is “hyperintense on T2 and FLAIR”, you can open exactly those series, scroll to the level, and see what the sentence means.
Hundreds of images, zero radiation
MRI earns its bulk differently than CT. There is no ionizing radiationinvolved: the scanner uses a strong magnetic field and radio-frequency pulses, and what it trades for that safety profile is time — each sequence takes minutes, which is why you spent the better part of an hour inside the machine. Every one of those sequences is its own stack of slices, often acquired in more than one plane, so a routine study easily reaches several hundred images and a spine or brain protocol can pass a thousand.
For you, two consequences. First: always transfer and open the complete folder— a single file from an MRI is a slice of one sequence in one plane, close to meaningless alone. Second: patience during loading is normal; the viewer shows its progress while your browser decodes the study, and a big protocol takes longer on a phone than on a laptop. If the disc also carries the radiologist’s report as a PDF, it opens here too, next to the images.
Adjusting an MRI: windowing without Hounsfield units
If you arrived from our CT viewer page, forget the preset table: it does not apply here. CT pixels are calibrated densities, so fixed windows like “lung” or “bone” mean the same thing on every scanner. MRI intensities are relative — the same tissue can map to different numbers depending on sequence, scanner and settings — so there is no universal preset to offer.
The working method is simpler: drag to adjust window and level until the tissue you care about separates from its surroundings, one series at a time. The viewer starts from the adjustment stored in the study, which is usually what the technologist considered readable. And because each sequence has its own scale, don’t be surprised that a setting that made the T1 legible turns the T2 into a white sheet — adjust per series, and lean on side-by-side comparison rather than a single “correct” setting.
What happens to your MRI when you open it here
To view it — nothing leaves your device. Your browser reads the files you selected, decodes the series and draws them locally; there is no upload, no copy on our side, and nothing survives the closing of the tab. You can check this in the browser’s Network tab while you scroll. That is also why the viewer needs no account.
The single exception is optional and explicit: if you ask for a link to send the study to your doctor, the study is uploaded after being encrypted on your device. The key travels in the link’s “#” fragment, which browsers never transmit to servers — so what we store, we cannot open. The link expires after 72 hours, admits a limited number of opens, and can be revoked; the file is deleted afterwards. Guard the link: without it, nobody — including us — can recover the study.
One honest boundary, the same one we give every visitor: this is a review viewer, good for understanding your study, checking what you were handed, and arriving at your appointment prepared. Diagnosis happens on calibrated displays and is your radiologist’s job — bring the report along with the images.
For clinicians: when the MRI must not live in a downloads folder
Opening the patient’s CD in this free viewer solves the consultation of the moment. It does not solve the follow-up in six months, when the comparison against today’s study is the entire point and the CD is long gone. The same viewer engine on this page ships inside Healthy Record’s clinical records: upload the study to the patient’s chart and it stays in their history — with access control, an audit trail of who opened it, and the report filed with the visit. There is a 14-day trial to test it with real studies. For everything the free page itself can open, see the online DICOM viewer overview.
Frequently asked questions
What is the difference between T1 and T2 images in my MRI?
They are two ways of weighting the same anatomy. On T1-weighted images fat appears bright and fluid dark, which makes them good for anatomy; on T2-weighted images fluid appears bright, which makes edema and inflammation stand out. FLAIR is a T2 variant where free fluid is suppressed so lesions near fluid-filled spaces become easier to see. Your study includes several of these on purpose — each answers a different question about the same tissue.
Why does my MRI have so many folders and hundreds of files?
Each folder is usually one series: a sequence (T1, T2, FLAIR, diffusion) acquired in one plane, and each series is its own stack of slices. Multiply a handful of sequences by two or three planes and by dozens of slices each, and hundreds of files is simply what a routine MRI is. Open the entire folder at once — the viewer sorts it into series for you.
Does an MRI use radiation?
No. MRI builds its images with a strong magnetic field and radio-frequency pulses, not ionizing radiation — that is a genuine difference from CT and X-ray. The price is time: every sequence takes minutes to acquire, which is one reason an MRI session is long and its studies are large.
Why are there no Hounsfield window presets for my MRI?
Because MRI intensities are relative, not calibrated physical units. In CT every pixel is a density in Hounsfield units, so fixed presets like “lung” or “bone” make sense; in MRI the brightness scale changes with the sequence and the scanner, so there is no universal number to preset. In this viewer you adjust an MRI by dragging until the tissue you care about separates — the study opens with the setting the technologist stored.
Can I compare two MRI series side by side?
Yes. The viewer can place two series next to each other — T1 against T2, or the same sequence with and without contrast — and you scroll them independently. Comparing weightings on the same slice level is exactly how an MRI is actually read, and it is the fastest way to understand what the report is describing.